Cloudwatch agent as a terraform module

TL;DR: I do not have time for reading this please take me to the examples
Let me kick start this blog post with the notation of a reusable pattern in engineering, which reminds me of a particularly amazing book that I have read recently. I find the following excerpt exceptional:
‘The purpose of a pattern is to provide general advice or structure to guide your design.’
Designing Distributed Systems: Patterns and Paradigms for Scalable, Reliable Services, by Brendan Burns, 2018
How I understand it which is also described further in the book, when designing distributed systems, instead of learning by failing (though inevitable most of the times) we can use pre-defined and reusable patterns that will help us in creating a robust and stable architecture. This doesn’t mean that the same approach works exclusively in IT. As an example try cooking a meal without a recipe. Being an enthusiast and practitioner of Infrastructure as code/software, I will be showcasing this paradigm with terraform modules.
Putting the big picture aside I am going to focus on one small bit, server monitoring on AWS’s EC2 service. One of the first ones that got created back in 2006 when the IaaS model was still in its infancy.
If you have worked with AWS before or you are still using it, it is very likely you have used the EC2 web console to spin up an instance. After requesting and getting an instance you will notice that EC2 provides server monitoring for the running instance(s) but it is by default, maybe by design as well, very basic.
To overcome the problem with the rudimentary monitoring we usually fall back to employing third-party services that give us more complete and comprehensive insights. Most of the times they do the job very well, but as usual, there are some drawbacks.
- Familiarity. We have to leave the the AWS web console and venture into the unknown third-party GUIs which are generally satisfactory, yet as a user that is habituated to the former, it can feel a bit disorderly. A lot of companies use more than one server monitoring provider and that is the moment when it becomes very trying.
- User management. When using a third-party service for server monitoring we need to somehow manage the users. I am not speaking about whether they offer SAML integration or not, but about the hindrance of managing users and Role-based access control.
- Alerting. It is much easier to create alarms in CloudWatch where both the API and the features are very complete.
- Infrastructure as Code/Software. The last but not the least, not all third-party server monitoring providers can be managed via an IaC tool.
You can see what I am aiming at right? CloudWatch Agent, a daemon that can collect system-level, custom metrics (using StatsD and collectd), logs both from EC2 and on-premise instances and dispatch them to CloudWatch. We can have all of the server monitoring metrics in one place and deployable as a reusable terraform module.
Click here for more information about the CloudWatch Agent.
But what is a terraform module?
This is how hashicorp describes terraform modules.
A module is a container for multiple resources that are used together.
Aside from that modules are reusable, versionable, testable, and callable from within other modules. They should be as small as possible to have a small blast radius in case of an error and to address the edge cases.
Terraform supports various source types for getting the source code of the modules.
module "cloudwatch_agent" {
  source = "git::https://github.com/cloudposse/terraform-aws-cloudwatch-agent?ref=0.2.0"

  name      = "cloudwatch_agent"
  namespace = "eg"
  stage     = "dev"

  aggregation_dimensions      = ["AutoScalingGroupName", "InstanceId"]
  disk_resources              = ["/", "/mnt", "/home"]
  metrics_collection_interval = "60"
  metrics_config              = "advanced"
}
So how does this particular module work?

The CloudWatch terraform module currently supports collecting metrics and can only be applied on AWS/EC2, however if you have an awesome idea for an improvement or are in need an additional feature, you can either make a contribution or open an issue or here: https://github.com/cloudposse/terraform-aws-cloudwatch-agent/
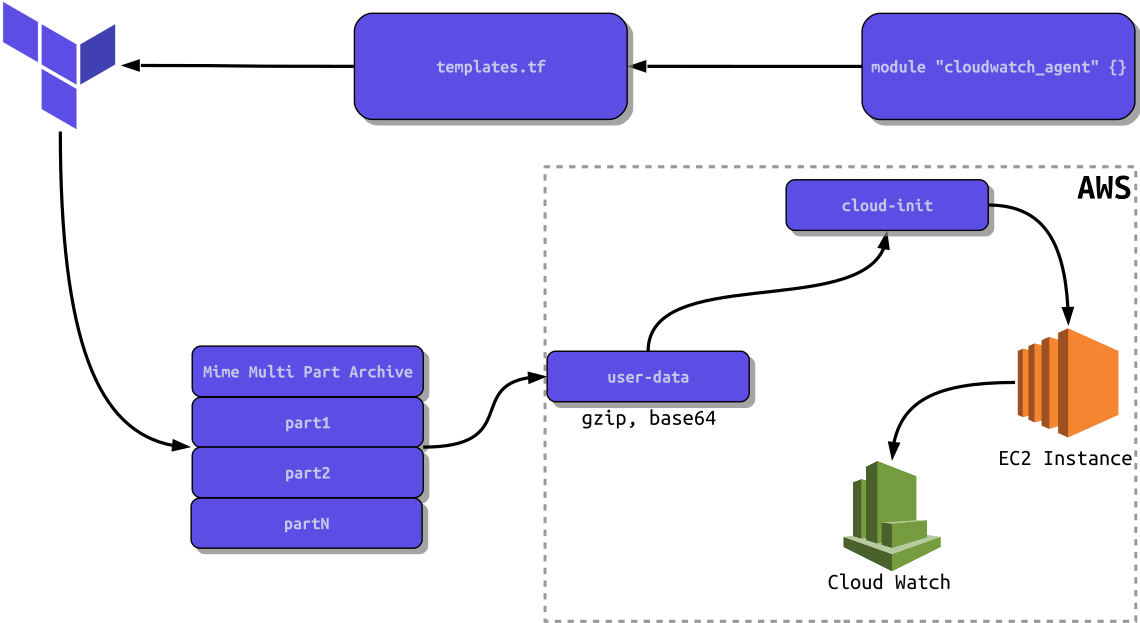
Packing it all together into a reusable module has its hardships. Let us start with the uncomplicated step, installing the CloudWatch Agent package by using cloud-init in order to detect the underlyin OS utilizing /etc/os-release, a systemd configuration file. This will download, install, and run the daemon.
runcmd:
  - |
    . /etc/os-release
    case $NAME in
      "Amazon Linux") echo "Installing the cloudwatch agent for Amazon Linux."
        curl -O https://s3.amazonaws.com/amazoncloudwatch-agent/amazon_linux/amd64/latest/amazon-cloudwatch-agent.rpm
        rpm -U ./amazon-cloudwatch-agent.rpm
        ;;
      Centos) echo "Installing the cloudwatch agent for Centos Linux."
        curl -O https://s3.amazonaws.com/amazoncloudwatch-agent/centos/amd64/latest/amazon-cloudwatch-agent.rpm
        rpm -U ./amazon-cloudwatch-agent.rpm
        ;;
      Debian) echo "Installing the cloudwatch agent for Debian Linux."
        curl -O https://s3.amazonaws.com/amazoncloudwatch-agent/debian/amd64/latest/amazon-cloudwatch-agent.deb
        dpkg -i -E ./amazon-cloudwatch-agent.deb
        ;;
      Redhat) echo "Installing the cloudwatch agent for Redhat Linux."
        curl -O https://s3.amazonaws.com/amazoncloudwatch-agent/redhat/amd64/latest/amazon-cloudwatch-agent.rpm
        rpm -U ./amazon-cloudwatch-agent.rpm
        ;;
      Suse) echo "Installing the cloudwatch agent for Suse Linux."
        curl -O https://s3.amazonaws.com/amazoncloudwatch-agent/suse/amd64/latest/amazon-cloudwatch-agent.rpm
        rpm -U ./amazon-cloudwatch-agent.rpm
        ;;
      Ubuntu) echo "Installing the cloudwatch agent for Ubuntu Linux."
        curl -O https://s3.amazonaws.com/amazoncloudwatch-agent/ubuntu/amd64/latest/amazon-cloudwatch-agent.deb
        dpkg -i -E ./amazon-cloudwatch-agent.deb
        ;;
      *)
        echo "Operating system not supported. Please refer to the official documents for more info https://docs.aws.amazon.com/AmazonCloudWatch/latest/monitoring/install-CloudWatch-Agent-on-first-instance.html"
    esac
  - /opt/aws/amazon-cloudwatch-agent/bin/amazon-cloudwatch-agent-ctl -a fetch-config -m ec2 -c file:/etc/cloudwatch_agent.json -s
At the very end, the command for starting the daemon references a specific configuration file file:/etc/cloudwatch_agent.json. It defines which sets of metrics and detail levels will be monitored from the OS. The AWS CloudWatch Agent has three levels of granularity detail, Basic, Standard, and Advanced. For convenience and simplicity, I have decided to use a pre-generated configuration file which has only the Standard and Advanced detail levels. I have generated the configuration file with using the Wizard.
Switching between the metrics granularity is done by passing the metrics_config parameter when invoking the module:
module "cloudwatch_agent" {
  source = "git::https://github.com/cloudposse/terraform-aws-cloudwatch-agent?ref=0.2.0"

  name      = "cloudwatch_agent"
  namespace = "eg"
  stage     = "dev"

  metrics_config = "advanced" # Accepts only standard or advanced.
}
Inside the main.tf within the module the metrics_config parameter will be used to either load the standard or the advanced configuration file with terraform conditionals.
data "template_file" "cloud_init_cloudwatch_agent" {
  template = "${file("${path.module}/templates/cloud_init.yaml")}"

  vars {
    cloudwatch_agent_configuration = "${var.metrics_config == "standard" ? base64encode(data.template_file.cloudwatch_agent_configuration_standard.rendered) : base64encode(data.template_file.cloudwatch_agent_configuration_advanced.rendered)}"
  }
}
For the EC2 instance to be able to send any metrics to CloudWatch we need to set the IAM permissions accordingly. The module exports both the role and the JSON Policy. Depending on our use case we can select between the two.
Here’s an example with using the role:
module "cloudwatch_agent" {
  source = "git::https://github.com/cloudposse/terraform-aws-cloudwatch-agent?ref=0.2.0"

  name      = "cloudwatch_agent"
  namespace = "eg"
  stage     = "dev"

  metrics_config = "advanced" # Accepts only standard or advanced.
}

resource "aws_iam_instance_profile" "cloudwatch_agent" {
  name_prefix = "cloudwatch_agent"
  role        = "${module.cloudwatch_agent.role_name}" # The exported role from the module.
}
Or using the JSON policy:
module "cloudwatch_agent" {
  source = "git::https://github.com/cloudposse/terraform-aws-cloudwatch-agent?ref=0.2.0"

  name      = "cloudwatch_agent"
  namespace = "eg"
  stage     = "dev"

  metrics_config = "advanced" # Accepts only standard or advanced.
}
resource "aws_iam_role_policy" "cloudwatch_agent" {
  name   = "cloudwatch_agent"
  policy = "${module.cloudwatch_agent.iam_policy_document}" # The exported JSON policy from the module.
  role   = "${aws_iam_role.ec2.id}"
}
This will get our CloudWatch agent up and running on our EC2 instance. For the observant eye, there is a serious flaw with cloud-init in the current setup. What will happen if we have already an existing cloud-init configuration? We should somehow make it work with the cloud-init configuration from the module. For this reason, the Mime Multi Part Archive capability from cloud-init was created which in terraform is a data source called template_cloudinit_config. The module takes care of the intricate Mime Multi Part Archive. The only change that needs to be done is adding the attribute userdata_part_content when calling the module, meaning that we are going to pass our cloud-init configuration and in return, we will get a Mime Multi Part Archive cloud-init which can be used in the launch_configuration:
module "cloudwatch_agent" {
  source = "git::https://github.com/cloudposse/terraform-aws-cloudwatch-agent?ref=0.2.0"

  name      = "cloudwatch_agent"
  namespace = "eg"
  stage     = "dev"

  metrics_config        = "advanced"
  userdata_part_content = "${data.template_file.cloud-init.rendered}" # This is where we pass the cloud-init to the module.
}

data "template_file" "cloud-init" {
  template = "${file("${path.module}/cloud-init.yml")}"
}

resource "aws_launch_configuration" "multipart" {
  name_prefix          = "cloudwatch_agent"
  image_id             = "${data.aws_ami.ecs-optimized.id}"
  iam_instance_profile = "${aws_iam_instance_profile.cloudwatch_agent.name}"
  instance_type        = "t2.micro"
  user_data_base64     = "${module.cloudwatch_agent.user_data}" # Multipart cloud-init from the module gzipped and base64encoded.
  security_groups      = ["${aws_security_group.ec2.id}"]
  key_name             = "${var.ssh_key_pair}"

  lifecycle {
    create_before_destroy = true
  }
}

resource "aws_cloudwatch_metric_alarm" "mem_available_percent_alert" {
  alarm_description = "Available memory for ${aws_autoscaling_group.ecs_cluster.name} is below 20 percent."

  alarm_name = "${aws_autoscaling_group.ecs_cluster.name}-mem-available-percent-alert"

  metric_name         = "mem_available_percent" # The metric name as reported by the CloudWatch Agent.
  namespace           = "CWAgent" # The namespace for the CloudWatch Agent.
  comparison_operator = "LessThanOrEqualToThreshold"
  evaluation_periods  = "1"
  period              = "60"
  statistic           = "Minimum"
  threshold           = "20"
  treat_missing_data  = "notBreaching"

  dimensions = {
    AutoScalingGroupName = "${aws_autoscaling_group.ecs_cluster.name}" # The name of the Autoscaling Group.
  }

  alarm_actions = [
    "${aws_autoscaling_policy.scale_up.arn}",
  ]
}
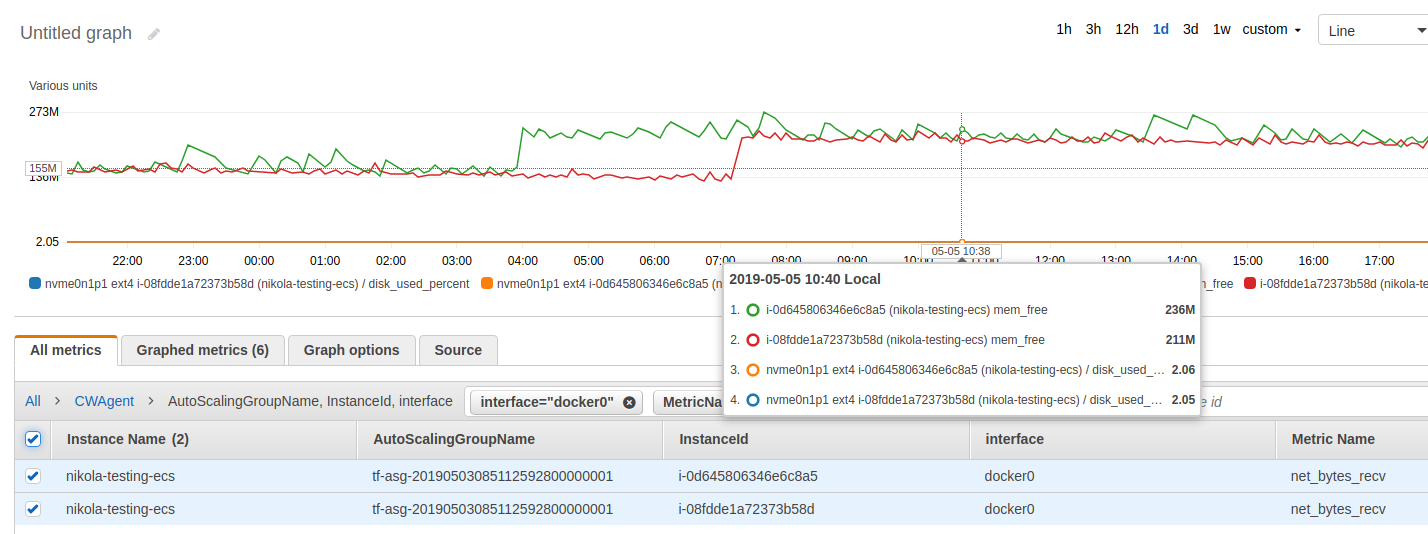
In the end we should have our metrics aggregated and shown in CloudWatch.

It is worth mentioning that the module provides further tailoring via the following parameters:
aggregation_dimensionsparameter which defaults to["InstanceId", "AutoScalingGroupName"]will aggreggate metrics so that alerting can be done within an autoscaling group.metrics_collection_intervalwhich defailts to60, specifies how often to collect the cpu metrics and if it’s below 60 seconds then AWS will bill those metrics as high-resolution ones.disk_resourceswhich defaults to/, Specifies an array of disk mount points. This field limits CloudWatch to collect metrics from only the listed mount points. You can specify*as the value to collect metrics from all mount points.
Click here for more information about all configuration parameters.
That is all for now. If you find this blog post useful and interesting please spread the word by sharing. For any suggestions and proposals feel free to contact me.